Question 12
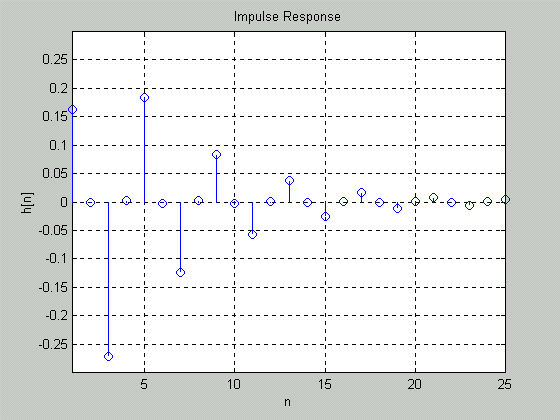
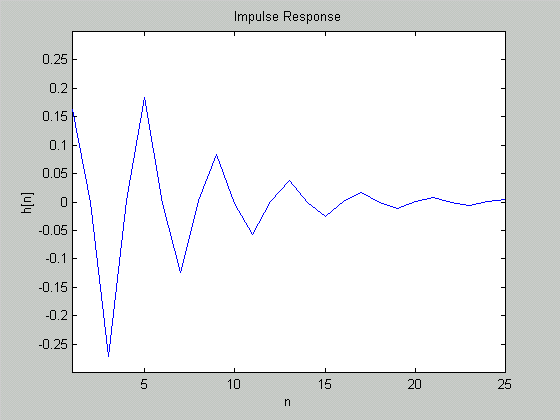
The Inverse Discrete Fourier Transform of the sampled frequency response was taken to obtain the impulse response h(n).
The resulting response was graphed:
Stem Graph

XY Plot

The impulse response matches the results obtained in question 5, as expected.
The Matlab Code from 12 can be seen here.
Optional Part
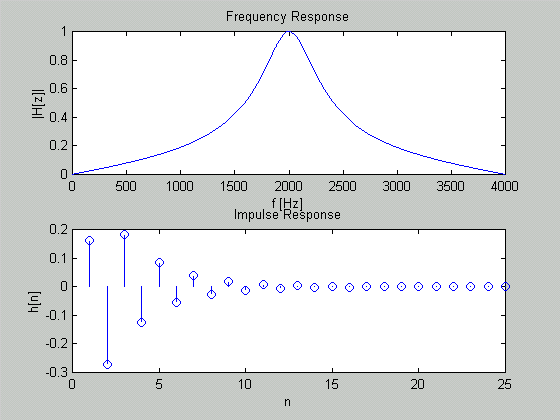
The question was repeated using Matlab and the standard FFT routine using N = 1024.
The graph of the impulse response obtained matches with the manually calculated results:

The frequency resolution was found to be .
The Matlab Code from 12(Optional) can be seen here.