Question 4
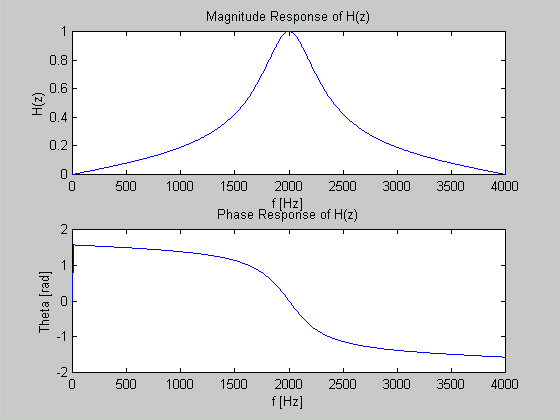
The frequency response of H(z) was plotted using both POI and Matlab and the results were compared.
Magnitude Frequency Response from POI
Phase Response of H(z) from POI

Results from Matlab

From the above Matlab Figure and from the corresponding code, the following data was obtained:
- phase shift at f_0 = 3.1633e-016 or approximately 0
- magnitude at f_0 = 1
- phase shift at f_0+B/2 = -0.7990 rads = 45 degrees
- magnitude at f_0+B/2 = 0.6974 approximately equal to 0.707
Matlab code for question 4 can be viewed here.