Repeat assignment 1 using the example Matlab code for assignment 2, and real data for the input vector x. Choose the real data to be at least one of voice, music, image, and describe the resulting sound or image after passing through a filter. Use the three filters of assignment 1.
Solution.
(a) For the impulse response of question 1 in assignment 1, filter coefficient vector b can be expressed as b = [0.5 1.0 0.5].
Each output value
![]() is the average of three consecutive input values with different weightings. We can observe that it has the characteristics of a low-pass filter.
is the average of three consecutive input values with different weightings. We can observe that it has the characteristics of a low-pass filter.
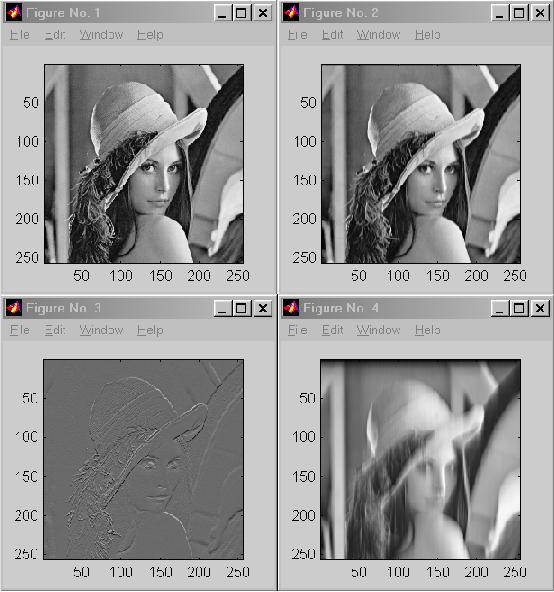
For the input image,'lenna.mat', output image y of the filter b is shown in Fig.1 No.2.
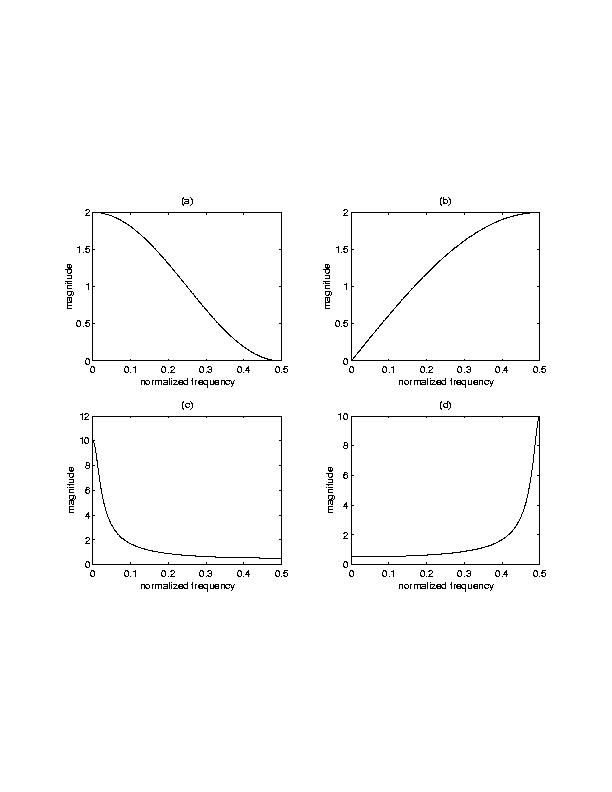
The filter's amplitude response for the normalized frequency is shown in Fig.2 (a).
(b) Now the filter coefficient vector b is b = [1.0 -1.0].
For input signals that are approximately constant, the output values are close to zero. For input signals that vary greatly, the output values are expected to be large. Therefore, this filter is similar to high-pass filter.
The output image y of the filter b is shown in Fig.1 No.3.
The filter's amplitude response for the normalized frequency is shown in Fig.2 (b).
(c) The filter coefficient vector a and b are:
a = [1.0 -0.9]
b = [0 1.0]
The output image y of the filter is shown in Fig.1 No.4.
The filter's amplitude response for the normalized frequency is shown in Fig.2 (c) for
![]() and in Fig.2 (d) for
and in Fig.2 (d) for
![]() .
We can observe that for the coefficient
.
We can observe that for the coefficient
![]() is negative, this filter behaves as a low-pass filter. For positive
is negative, this filter behaves as a low-pass filter. For positive
![]() ,
it behaves as a high-pass filter.
,
it behaves as a high-pass filter.
|